The Earfull November 9, 2026
Renk Soybean Lineup: What We Saw in 2026
Yield, disease packages, and placement: tested where soybeans are grown.
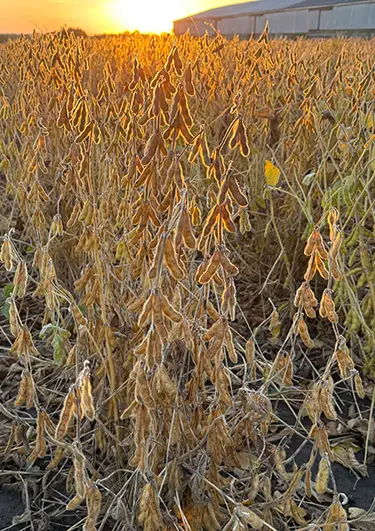
Most of the beans are in the bin, and plot data is rolling in; now is a good time to review 2026 and start lining up soybean acres for next spring. The Renk soybean lineup runs from 0.1 to 3.9 maturity, with 27 Enlist E3® products and 7 XtendFlex® products, and 14 of them carry the new tag on the chart.
Every soybean on the chart has to earn its spot in the plots. Renk research, dealer, and grower plots across Wisconsin, Minnesota, Michigan, Iowa, Illinois, and the Dakotas put these varieties side by side with each other and with competitive beans.
2026 Observations
Renk soybean plots were harvested at 92 locations in 2026, from North Dakota and western Minnesota down through Wisconsin, northeast Iowa, northern Illinois and Michigan’s Thumb. Across all those plots, yields averaged about 66 bushels with harvest moisture right around 12%. The best numbers came from southern Wisconsin, northern Illinois, and Iowa, where several plots averaged more than 80 bushels, with the top Renk entries pushing past 90. Western Minnesota, the Dakotas and parts of Michigan had a tougher year, with a few plots finishing in the 30s and 40s.
The headline is that the new varieties stormed into the lineup. We’ve never had a rookie class as high performing.
G0710E: Brings G0800E-type yield with a class-leading IDC rating.
G1110E: Brought on to deliver yields in line with G1260E, the yield champion. It did just that, showing an advantage in the Red River Valley and liking the eastern plots. It is best in class IDC and carries the Peking gene for cyst issues.
RS167E: Its numbers are not as flashy as expected; it shows a very clear advantage in Wisconsin and Michigan over G1560E, the maturity yield leader.
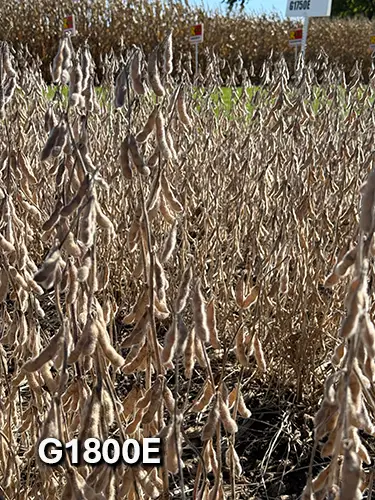
G1800E: Put up giant yield numbers as an experimental last year and matched them this year. We are seeing +3bu/acre over G1980E and G2150E. Couple this with elite white mold tolerance and this will be a hard one to ignore.
G1910E: Put up stronger numbers than G1800E the prior year in research but was slightly behind it this year. Still head and shoulders above older products. IDC and SDS scores make it compelling for western acres.
G2210E: Yield is coming in at +4.9 bushels over G2150E in plots! It’s holding its ground against G2300E in Iowa and Minnesota.
G2410E: Is the big gorilla for yield. It is 31W-17L versus G2300E, which had another outstanding year. +4.4 bushels against RS2480E. A must have for this maturity group.
G2710E: Yield data is slightly better than G2900E, RS266E, and G2480E. A tough trifecta to beat.
G3000E: Very strong when planted in its proper maturity. Many of our plots are on the early side for it.
G3210E: The one to beat in the early- to mid-group 3 lineup. Dominates competitors.
G3610ES, G0200E, and G0510E: Not enough plot data at this writing.
Maturity Placement
Early (0.1 to 0.9): G0180E brings a bulletproof disease package, and the new G0200E adds about a bushel and a half on top of it. New G0510E packs a lot of yield for a 0.5 and is a salt excluder, and new G0710E is the iron deficiency chlorosis leader in the group. G0750E dominates western acres, and G0800E brings strong white mold and brown stem rot tolerance for Wisconsin and Michigan, plus chlorosis and sudden death syndrome tolerance for the west. These fit northern Minnesota, North Dakota, and northern Wisconsin.
Early to mid 1s (1.0 to 1.6): G1110E is putting up a strong case to be the “go to” bean on the early side, especially in IDC and cyst-prone soils. G1260E will not go quietly since many people love it for its ability to move south and its proven yield track record. G1560E is strongest west of the Mississippi, and RS166E is expected to shine east of it.
Late 1s (1.7 to 1.9): G1800E and G1910E are vying for dominance in this maturity group. We carry both varieties and can be the 1-2 punch on customer acres. G1800E has shown consistent yield east to west in both years of our own testing. G1910E was more dominant west in 2025 but more dominant east in 2026. My hypothesis for this is that the G1910E performs best under drier conditions.
Each has specific acres where it’s the clear choice. White mold resistance is G1800E’s calling card, while IDC and sudden death-prone acres should use G1910E.
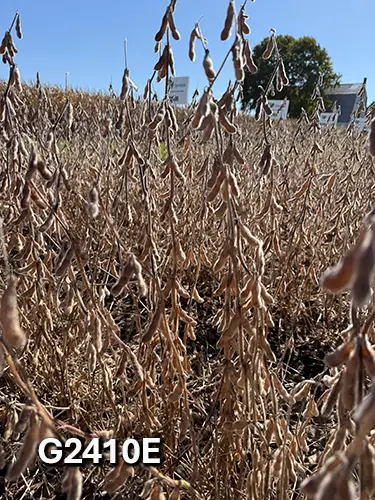 Early to Mid 2s (2.0 to 2.4): This is such a high-yielding group that it’s hard to go wrong with any of them. Hard to ignore the dominance of G2300E the last two years, but G2410Es are showing even better numbers with improved scores on SDS and white mold. G2210E is on the early side, with the bonus of the Peking gene for those high-cyst soils.
Late 2s (2.5 to 2.9): This group is very tight in yield across the board. I still like RS266E a lot on the early side until we get a longer track record with G2710E. The caution with RS266E is for known white mold acres. G2710E can be worked into the lineup in acres where G2900E is too late.
Group 3s (3-3.8): The choice here will be driven more by actual maturity wanted. G3000E is an exceptional product when in its proper maturity. G3210Es may have the most yield potential among G3000E, G3210E, and G3610ES. G3610ES adds the STS option, and G3890E still looks like the one to beat on the late side.
Picking the Right Fit
Start with maturity. The adaptability map in the seed guide shows each zone, and a variety moved north or south of its zone will change how it matures and how tall it gets. From there, look at what has limited yield on that field and match it to the disease ratings and Phytophthora gene on the chart.
Soybean cyst nematode deserves a closer look this winter. Iowa State reports that nematode populations across the Midwest have adapted to PI 81788 resistance, and recommends rotating PI 81788 varieties with Peking varieties rather than using one source every time. The Renk lineup has Peking options in G1110E, G1980E, G2210E, and G3000E. Then pick the herbicide system, Enlist E3® or XtendFlex®, and the seed treatment, either the Defender Package or the SDS Package on fields with a sudden death syndrome or nematode history.
Planning Your 2027 Soybean Acres
- Plant more than one variety. Spreading maturities lowers risk and widens the harvest window.
- Pull soil samples for soybean cyst nematode this fall. Knowing the numbers makes it easier to decide when to switch to Peking.
- Put white mold tolerance where the canopy closes fast. Narrow rows, high populations, irrigation and fields with a history of white mold are where it matters most.
- Match chlorosis tolerance to high-pH ground. On western acres, this rating often decides the field before yield does.
Looking Ahead to 2027
From far-north 0s to full-season 3s, the Renk soybean lineup has a bean for nearly every acre. Talk with your Renk dealer or DSM to match products to your fields and your field history.
References
- Iowa State University Extension and Outreach, Integrated Crop Management. Soybean Cyst Nematode-resistant Soybean Varieties for Iowa in 2027.
https://crops.extension.iastate.edu/cropnews/2026/10/soybean-cyst-nematode-resistant-soybean-varieties-iowa-2027 - University of Wisconsin Division of Extension, Nutrient and Pest Management. Integrated Approaches to White Mold Management.
https://extension.soils.wisc.edu/wcmc/integrated-approaches-to-white-mold-management/ - Michigan State University Extension. Bulletin E-3431: How to Read a Seed Guide (Soybean Edition).
https://www.canr.msu.edu/resources/bulletin-e-3431-how-to-read-a-seed-guide-soybean-edition
The Earfull September 7, 2026
What is This Crop Telling Us?
The combine gives us the final yield number. A walk through the field before harvest helps explain why. This is the time to look for premature plant death, weak stalks, diseased roots, and the field patterns behind them.
Corn: Ghosted Plants and Dead Tops
Scattered corn plants that look gray-green, brown, or finished well ahead of their neighbors are often called “ghosted” plants. They may point to crown rot, stalk rot, or both. Do not diagnose them from the road—dig plants, keep the root ball intact, and split the lower stalk through the crown.
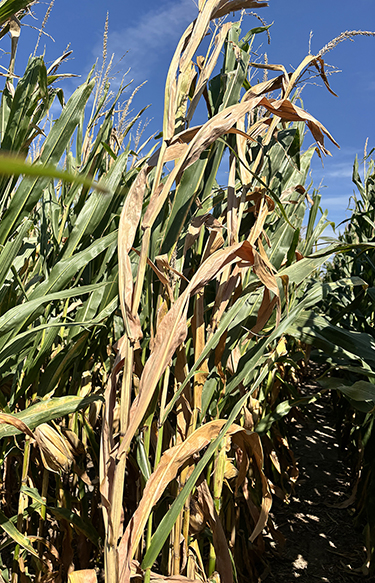
A rotted, brown-to-black crown; discolored roots; deteriorated pith; or weak lower internodes all point to a standability concern. These issues often start much earlier than when symptoms appear. Cool or wet soils, slow emergence, compaction, restricted roots, nutrient stress, saturated areas, and late grain-fill demand can all leave plants more vulnerable.
Also look up in the canopy. Scattered plants with a dead flag leaf and browned leaves or stalk above the ear may have anthracnose top dieback. It can resemble ghosting because the plant is dying early, but the top-down pattern is the clue. The upper portion of the plant dies while leaves around the ear or lower in the canopy may remain green.
Peel back upper leaf sheaths on suspect plants. Shiny black, elongated lesions on the stalk rind support an anthracnose diagnosis. Check the lower stalk, too. Top dieback often occurs with stalk rot, and a dead top alone does not tell you whether the plant will lodge.
Not every brown plant or dead top is disease. Heat and drought can kill upper leaves, often across a larger dry area of the field. Insect injury and other stresses can look similar. Compare affected plants with healthy neighbors, split stalks, and send samples for diagnosis if the cause is uncertain.
Let standability set harvest order
There is no late-season rescue treatment. The immediate priority is to identify fields most likely to lodge and put them ahead of stronger fields in the harvest plan. Begin near black layer and walk each field. At five or more stops, use both a pinch test on the lower internodes and a push test: push plants about 30 degrees from vertical and see whether they return upright.
A field with roughly 10% failed plants deserves attention and should be scheduled early. At 10–15% failed plants—or where crown rot, shredded pith, weak lower nodes, or lodging is concentrated in meaningful acres—move that field to the front of the line. Do not let a field with compromised stalks wait for the calendar just because grain is drying down well. Wind, rain, and continuing stalk decline can turn a manageable problem into ears on the ground.
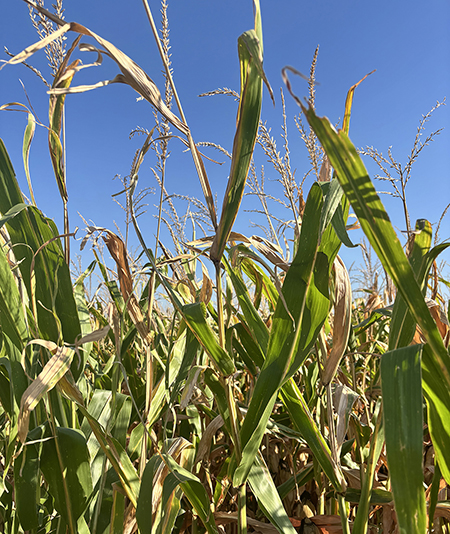
When a high-risk field reaches physiological maturity, it can be worth taking it at approximately 20–25% grain moisture and drying it rather than waiting for ideal field-drydown moisture. The drying bill has to be weighed against lost ears, slower harvest, extra header loss, and the time required to pick up lodged corn.
If a weak field is already below 20% moisture, the margin for waiting is usually gone. Grain is not gaining meaningful drydown value fast enough to justify increased lodging exposure, and dry, weakened stalks can continue to fail. Harvest it as soon as logistics allow. Keep ground speed down in lodged spots, run the header close to the ground, and consider harvesting against the direction plants are leaning to reduce missed ears.
Record the hybrid, field location, soil conditions, drainage, population, fertility concerns, and severity while symptoms are still visible. Those observations help make better placement and management decisions next season.
Soybeans: SDS or Red Crown Rot?
Soybean plants with yellowing and browning between leaf veins are worth digging now. Sudden death syndrome and red crown rot can look similar from above the canopy, but the roots and lower stem help separate them.
Sudden death syndrome typically causes yellow areas between green veins that become brown and dead. As symptoms worsen, leaflets often drop while the petioles remain attached to the stem. Roots can be decayed, and blue fungal growth may sometimes be visible. Disease risk is often greater in fields with cool, wet planting conditions, compaction, poor drainage, or soybean cyst nematode pressure.
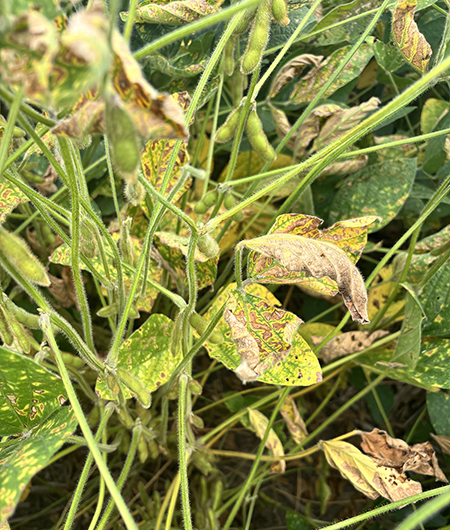
Red crown rot can cause similar interveinal yellowing and browning, but it more directly affects the roots and crown. Dig whole plants and inspect the lower stem at the soil line. Reddish discoloration at the stem base, severe root rot, and small reddish-brown fungal structures under favorable conditions are important clues. Unlike sudden death syndrome, plants affected by red crown rot often retain dead leaves.
Neither disease has an in-season cure. Flag affected areas and confirm red crown rot with a diagnostic lab, especially where it is new or suspected. For next year, use field observations to guide variety selection, soybean cyst nematode sampling and management, drainage and compaction improvements, and seed-treatment decisions. Crop rotation and avoiding movement of soil from suspect areas can help reduce red crown rot risk, but neither practice will erase a field history overnight.
Take Home
Every field tells a story. A few shovel digs, split stalks, standability checks, and notes before harvest can turn late-season symptoms into a better plan for hybrid placement, harvest timing, and disease management next year.
References
- Freije, A., Wise, K., & Nielsen, R. (2016). Diseases of corn: Stalk rots (BP-89-W). Purdue Extension. https://www.extension.purdue.edu/extmedia/BP/BP-89-W.pdf
- Adee, E., & O’Mara, J. (2026). Sudden death syndrome in soybeans: Symptoms, diagnosis, and management. K-State Research and Extension.
https://www.agronomy.k-state.edu/eupdates/2026/issue-1118-august-27/sudden-death-syndrome-in-soybeans.html - Camiletti, B. (2025). Red crown rot progressing in Illinois: Symptoms confirmed in Shelby County commercial fields. University of Illinois Department of Crop Sciences.
https://farmdoc.illinois.edu/field-crop-production/red-crown-rot-progressing-in-illinois-symptoms-confirmed-in-shelby-county-commercial-fields.html
The Earfull August 31, 2026
As Harvest Nears
As we move into September, drought is becoming one of the biggest variables separating fields across the Renk Seed area. The map does not tell the entire story—and neither does a drive down the road. Some acres caught timely rain and still have strong finish potential. Others have been running short of water for weeks, and they are showing it in earlier drydown, lighter grain fill, shorter plants, weak pod fill, or uneven maturity.
The latest U.S. Drought Monitor puts the sharpest late-season concern across parts of Minnesota, western and northern Wisconsin, and Michigan’s Upper Peninsula. Severe drought (D3) expanded across northwestern Wisconsin and into eastern Minnesota during the August 25 assessment. The same update noted some relief from showers in Michigan and southern Wisconsin, while another dry week aggravated ongoing impacts farther north and west.
That pattern lines up with what makes drought difficult to manage across the Renk Seed area: there is no single “Renk crop condition.” From Michigan into Wisconsin, Minnesota, the Dakotas, western Iowa, and
non-irrigated Nebraska, rainfall has been highly variable. Two fields only a few miles apart can be headed into harvest with very different yield, moisture, feed-value, and plant-health stories.
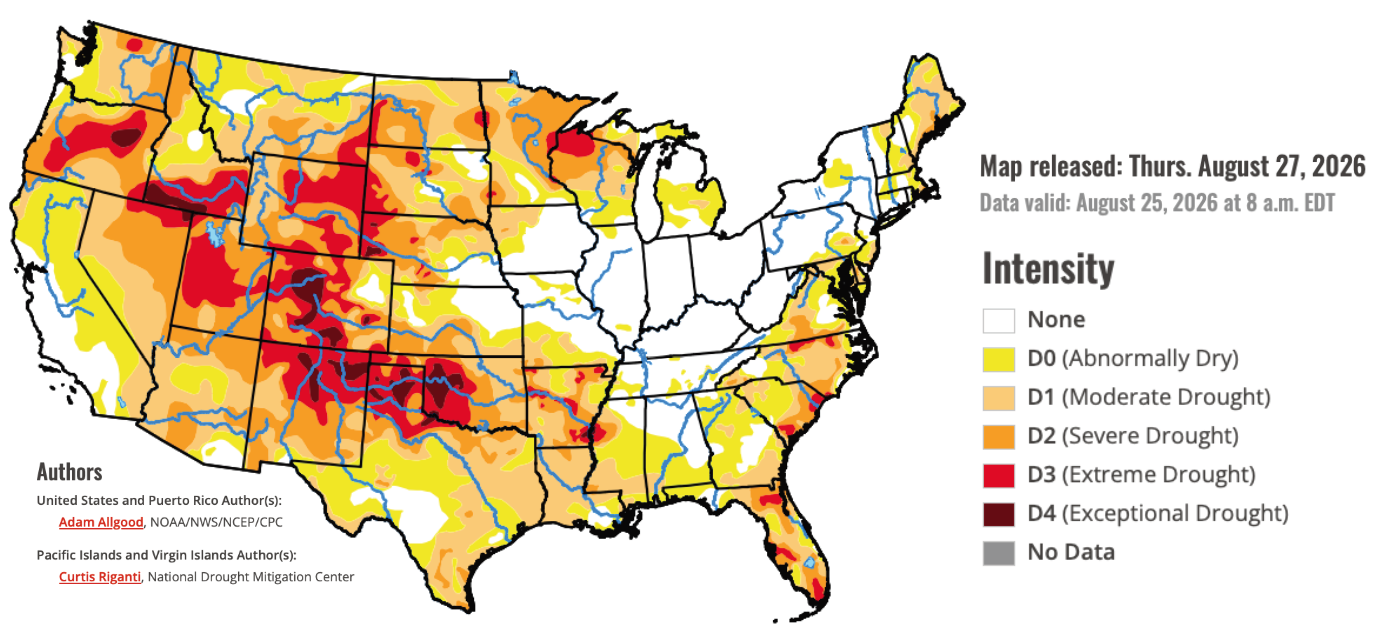
https://droughtmonitor.unl.edu/CurrentMap/StateDroughtMonitor.aspx
Corn: Grain Fill Is Still the Question
Corn is far enough along that the yield ceiling has largely been set, but late-season stress can still affect what makes it into the bin. Corn plants that ran short of water during grain fill may finish faster, show premature firing, lose stalk integrity, and end up with lighter kernels. The crop may look like it is “drying
down nicely,” when the reality is it’s finishing early because it ran out of water.
That is why field-by-field scouting matters right now. Pull ears from the good, average, and stressed areas
of each field. Look beyond kernel number and evaluate kernel depth, tip fill, ear consistency, plant health,
and stalk condition. Compare those observations to soil type, planting date, hybrid placement, rainfall timing, and any compaction or drainage pattern. The result is a much more useful harvest conversation than a whole-field estimate made from the road.
Late-season drought also raises the importance of stalk quality. A stressed plant may remobilize carbohydrates from the stalk to finish the ear. Add leaf disease, nutrient stress, root restriction, or insect feeding, and the risk of stalk cannibalization and lodging can increase. Prioritize fields with weak lower stalks, heavy ear load, visible firing, or early plant death for harvest rather than leaving them until last.
For irrigated acres, the decision is not simply whether the season has been dry. It is whether enough usable water remains in the root zone to finish the crop. Corn at beginning dent can still use about 2 inches of water through maturity, while corn at half milk line has about 0.8 inch remaining. The best final-irrigation decision combines growth stage, actual root-zone moisture, and the near-term forecast—not the calendar alone.
Corn Silage: Moisture Moves Fast in Stress Fields
Drought-stressed silage corn can move from “not ready” to “too dry” quickly. Whole-plant moisture must drive harvest timing; calendar date, kernel milk line, and field appearance are useful clues, but they are not a substitute for sampling. In a variable field, pull representative plants from multiple zones. Sandy ridges, shallow soils, compacted headlands, and the best portions of the field may not be at the same moisture.
Dry silage is harder to pack and is more vulnerable to heating and spoilage. Lower biomass also changes the feed-inventory conversation, especially on dairy and livestock operations that were counting on a normal-tonnage crop. If plants are drought-stressed, evaluate both quantity and quality before finalizing chop plans. Shorter cut length, careful kernel processing, aggressive packing, prompt covering, and a realistic inventory estimate become even more important when the crop is dry and variable.
Soybeans: Pod Fill and Plant Health Still Matter
Soybeans generally have more flexibility to recover from stress than corn—until moisture is short during pod and seed fill. The University of Minnesota notes that soybeans at beginning seed (R5) may use about 2.9 inches of water through maturity, compared with about 1.2 inches at full seed (R6). A timely rain can still add seed size and help retain yield; continued stress can mean small seed, aborted pods, uneven maturity, and a field that is ready sooner than expected.
Walk soybean fields with two questions in mind: Is this drought, or is drought exposing another problem? Dry conditions can make potassium deficiency, compaction, shallow rooting, soybean cyst nematode, sudden death syndrome, white mold history, herbicide injury, and poor drainage patterns easier to see. Symptoms that line up in zones or patches deserve a closer look before the combine erases the evidence.
This is also a good time to watch for green stem, uneven maturity, lodging, and late-season disease. In North Dakota, soybean condition is declining in much of the region under drought, along with reports of late-season potassium deficiency. Drought can reduce potassium movement to roots and make deficiency symptoms more apparent even in fields that are not extremely low in soil-test K. There may be no practical rescue treatment now, but these fields should be flagged for fall soil sampling, yield-map review, and next season’s fertility plan.
What Does It Mean?
This is not a year to make broad conclusions from one yield monitor map or one field visit. Drought response is a combination of rainfall timing, soil water-holding capacity, rooting depth, crop stage, hybrid or variety placement, fertility, and field history. The fields that look best today are not always simply the ones that received the most rain; they are often the fields that captured and held water, established roots early, and had fewer secondary limitations.
As harvest starts, the most valuable work may be documenting the story behind performance. Note the fields that held green longer, filled grain better, retained pods, maintained stalk strength, or stayed more consistent across soil zones. Just as important, document the fields that fell apart early. Was it light soil? Compaction? A planting-date issue? Fertility? Disease? A hybrid-by-field mismatch? Rainfall timing? Those notes turn this year’s drought into better product placement, better agronomy conversations, and better decisions for 2027.
Heading Into Harvest: What We’re Watching
- Scout before scheduling. Check stalk strength, ear retention, kernel depth, plant death, pod fill,
and maturity differences. Prioritize fields with lodging risk or fast dry-down. - Sample silage often. Use whole-plant moisture from representative areas—not just one grab sample
or milk line—to time chopping. Stress fields can vary greatly and dry rapidly. - Know the feed story. Estimate silage tonnage conservatively, manage packing and storage carefully,
and test drought-stressed feed for nitrate risk before feeding. - Separate drought from other causes. Flag patterns that match soil type, compaction, drainage, fertility, disease, or traffic. Harvest maps are much more valuable when they are paired with field notes.
- Watch soybean finish closely. Fields at R5-R6 can still respond to moisture, but drought may speed maturity and reduce seed size. Be ready for uneven dry-down and harvest timing.
- Use harvest to build next year’s plan. Pull post-harvest soil samples where conditions allow, especially for residual nitrogen and in fields with drought-related variability. Compare yield maps with drought zones and scouting notes before finalizing product placement.
A drought year has a way of exposing the limits in every field—but it also provides some of the clearest information we get. The goal now is not to explain every acre before the combine rolls. It is to capture
the observations that will help make the next crop more resilient.
References
- U.S. Drought Monitor. “Midwest Drought.” Data valid August 25, 2026.
- University of Minnesota Extension. “Do I need to irrigate again? Late-season irrigation considerations.” August 24, 2026.
- North Dakota State University Extension. Crop & Pest Report. August 27, 2026.
The Earfull August 24, 2026
Pro Farmer Crop Tour Recap 2026
The Pro Farmer Crop Tour is officially in the books, and if you’ve been hearing insight from this tour on TV or social media, you already know the story: corn backed off last year’s record pace, but soybeans are hanging tough and could still set a new high. Here’s what we’re seeing, why it’s shaking out this way, and what it means as we start turning the page toward harvest.
What the Tour Found
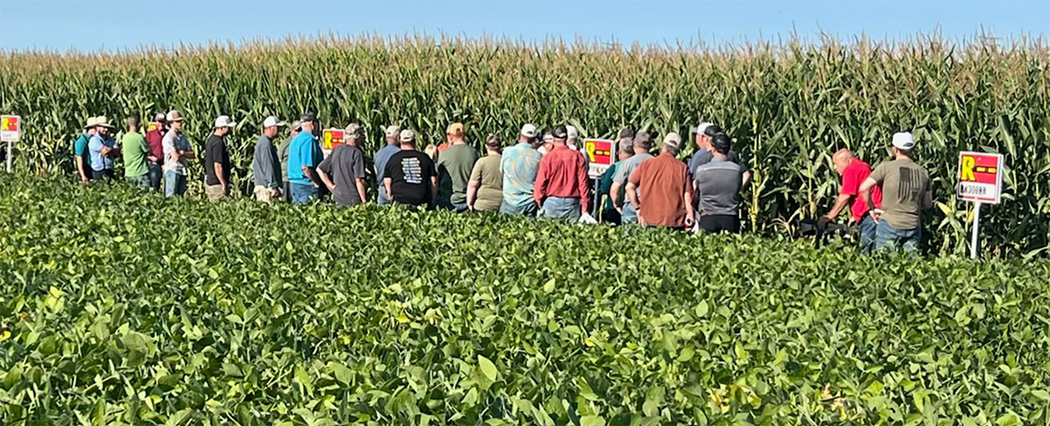
Scouts wrapped their seven-state run in Rochester, Minnesota, and the takeaway was pretty simple — corn is down from 2025 almost across the board, while beans are holding up well and might still notch a national record. Pro Farmer’s national corn number came in at 173.2 bu/acre, about 7.5 bushels below USDA’s 180.7 estimate, for a crop of roughly 15.344 billion bushels. Soybeans are pegged at 53.3 bu/acre nationally, good for a 4.572-billion-bushel crop — above USDA’s own number and a potential record if it holds through harvest. Tour leader Chip Flory summed it up well: “Everything is down from a year ago… except for Minnesota soybean pod counts.”
Why This Year Looks Different
Early-season stress is really the story here. Cool, wet conditions and delayed planting set corn back on ear counts and grain length, and that kind of early-season hit doesn’t get made up later. Soybeans had an easier path — with more time to fill pods once conditions improved later in the summer, which is why beans are outperforming corn relative to both last year and the recent average. South Dakota took the hardest hit of the tour, with real heat stress showing up in both crops. Illinois stood out as one of the few areas down from both 2025 and its own three-year trend — a tougher combination than most states saw. Iowa and Minnesota corn, by contrast, came in below last year’s record but still landed above their three-year averages, so there’s real quality in those fields even without a repeat of 2025.
Worth mentioning to growers who might be going off USDA’s numbers alone: the Tour’s actual field counts and USDA’s survey-based estimates don’t always agree. Ohio’s USDA number implied a slight increase from last year, but the Tour’s pod counts showed a 7% drop, and South Dakota had a similar gap between the two data sets. If you are working off USDA’s more optimistic figures, it’s a good time to walk and see what is showing up in your fields.
What This Means for Renk Growers
This is shaping up to be a year where hybrid and variety selection really show their value — the fields that held up best through early stress were the ones with strong stress tolerance and root development going into pollination. It’s a good reminder heading into fall plot walks and next year’s seed conversations that genetics built for resilience, not just top-end yield in a perfect year, are what separate a good year from a great one when the weather doesn’t cooperate.
Heading Into Fall – What We’re Watching
- Get out and walk fields now, before harvest: ear counts and stand checks in-season help you understand what your crop looks like, and you can start to create your fall plan (yes, a plan never is perfect, but it’s a start).
- Lean into what your crop is telling you; both for corn and soybeans, there is some late-season disease and moisture stress showing, both dry and wet conditions, and what does that mean at the end?
- Pay extra attention to fields in areas that lagged their three-year average – worth digging past “just weather” to see if disease, fertility, or drainage played a role too. The role of fertility is an area that one can question: What is the true cost of cutting back? [2027 looks to be another higher-than-average cost.]
- Start pulling yield and moisture checks, especially if you are planning on chopping corn for silage, as many reports of whole plant moisture are below 70%, which is “Go Time!” (Reminder: especially in stress fields, that moisture will change greatly across that field.)
- Keep notes now on what performed above expectation this season – this is exactly the kind of insight that shapes next year’s product recommendations but should not be the only part of the recommendation. One-year wonders also happen in the stress years.
References
- “Corn Falls Short of Last Year’s Record, But Soybeans Eye New Highs.”
- Pro Farmer. “Pro Farmer Estimates 2026 U.S. Corn Crop at 15.344 Billion Bushels, Soybeans at 4.572 Billion Bushels.”
- Pro Farmer. “First Thing Today: Crop Tour Finds Lower Yields in Ohio, South Dakota.”
The Earfull August 10, 2026
What the Ears Are Saying
Corn pollination has moved from “about to happen” to “already in the rearview” on a lot of acres. From the road, many fields still look strong. The real story now is on the ears themselves. The key three questions:
- Did this field actually pollinate well?
- Where are the weak spots hiding?
- How do we turn today’s ears into a useful yield and management conversation for fall?
The right time to look is…
- Tassels are mostly done or nearly done shedding.
- Silks have turned brown and are starting to dry down.
- You’re roughly 5–10 days past peak tassel in that field.
The fields that might be the best to pull into the driveway and see what the ears are saying: 1) Fields that hit tassel during a hot, dry stretch; 2) Lighter soils, compacted ends, and uneven zones that rolled early;
3) Later‑planted fields that just wrapped pollination under a different weather pattern. Then you will know which fields look good with ears that back that up—or don’t.
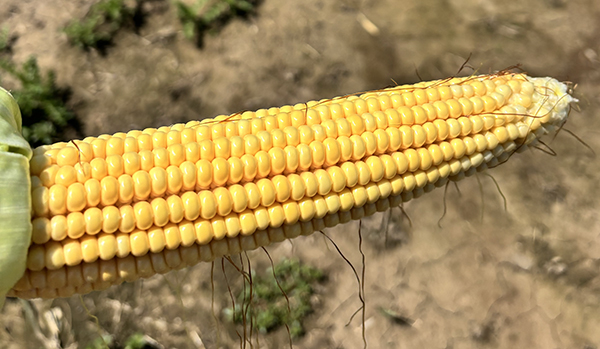 The ear silk shake test simple, quick, visual
You don’t need a complicated procedure to grade pollination. The straightforward shake test that works well in the field. It takes about 30 seconds per ear and gives you a clear picture.
- Walk 50–100 feet in and pull 3–5 plants in a row.
- Choose ears where silks are mostly brown and dry.
- With a sharp knife, slice the husks from butt to tip and peel them back, leaving silks attached.
- Hold the ear horizontally and gently shake it.
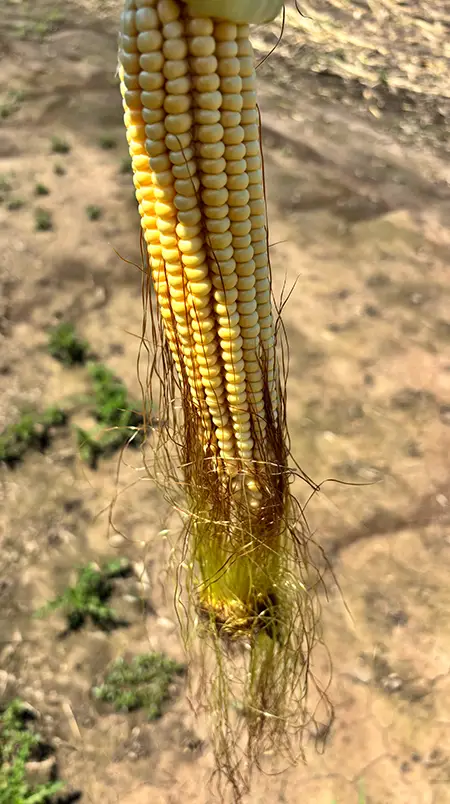 Watch what the silks show you. Silks that fall away are tied to fertilized kernels. Silks that stay stuck mark ovules that never got pollen. You don’t need a chart. Your eyes do the work.
As kernels move deeper into grain fill, it’s worth taking a second look at ears you checked earlier in pollination and see how they’re actually filling out. A little “tip‑back”—a short, blank section at the very end of the cob—is common and can come from either late silks that never caught pollen or from the plant quietly aborting the youngest kernels when it doesn’t have the energy to finish them. What deserves more attention is how that poor fill shows up. If the blank area is limited to the last half‑inch or so at the tip, the field may still be in good shape. When blank space or shriveled, aborted kernels start marching further down the ear, or when you see entire rows missing along one side of the cob—the classic “zipper” pattern—this points to more serious stress during early grain fill. In those cases, the plant set kernels but later ran short on photosynthate due to drought, heat, nutrient limitations, or heavy disease pressure, and it shed part of the load to protect the remaining kernels.
Turning ears into a yield range
What is the yield of this field? Here is a basic method to calculate the range:
- In 30‑inch rows, measure a row length of 17’ 5” (1/1000 acre).
- Count the harvestable ears in that stretch and multiply by 1,000 for ears per acre.
- Count kernels per ear (# of kernel rows × # kernels length) – only count actual kernels—skip blank cob and severely aborted tips.
- Yield (bu/ac) ≈ (ears/acre × kernels/ear) ÷ 85,000–95,000. Use around 85,000 if the crop is healthy and kernels look like they’ll fill well; use closer to 95,000 if stress has obviously thinned or shortened them.
Soybeans: pod set check, not pod count marathon
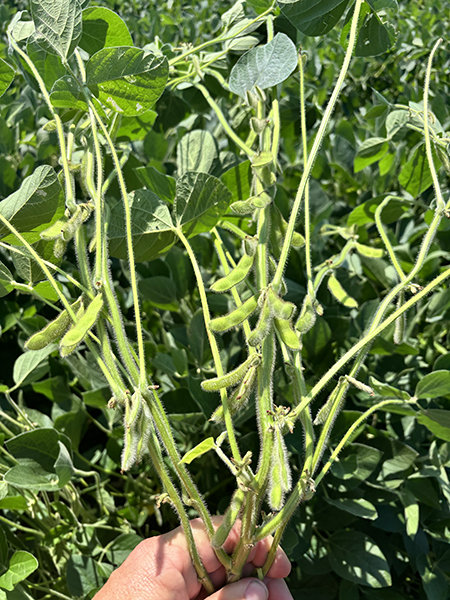
While we’re focused on ears, soybeans are quietly making their own big decisions. Many fields are in full pod to early seed (R3–R5). This is when beans decide how many pods to keep and work on how full those pods will be.
You don’t have to count every pod to learn something useful. Three quick questions in beans:
- How is pod load spread up the plant? Walk the row and pull a few plants. Look for pods building from mid‑canopy into the upper third of the plant. A good plant usually has pods stacked on most nodes, not just at the bottom.
- Where are pods being shed? Some flower and tiny pod drop is normal; beans use it as a safety valve.
The worry point is heavy pod loss up top or on branches that line up with late-season stress—
heat, drought, or disease. - What could trim seed size from here? Dense canopies, warm nights, and sticky mornings are great for disease. Fields with a history of white mold or SDS deserve closer attention as we move deeper into pod and seed fill.
Recent soybean growth‑monitoring work reinforces a simple truth. What happens in August can push you from “average” to “better than expected,” or quietly shave a few bushels off the top.
References
- University of Wisconsin–Madison Extension. “Concerns about Drought as Corn Pollination Begins.” Wisconsin Corn Agronomy.
- Purdue University Agronomy. “Estimating Corn Grain Yield Prior to Harvest.”
- Iowa State University Extension and Outreach. “Corn Yield Estimates.” Integrated Crop Management.
The Earfull July 20, 2026
As Fungicide Season Moves from Discussion to Decision
Across much of the Renk sales area, fungicide season in corn and soybeans is no longer a planning conversation. It is an active decision window. Some acres are already being sprayed. Others are being watched closely as fields move into tassel, early silking, flowering, and beginning pod. That makes this a good week to simplify the discussion. The question is not whether fungicides can work. The question is where they still fit, what conditions deserve quicker action, and which acres should probably not be forced into a pass just because the calendar says it is fungicide time.
This also feels like one of those weeks when general disease talk can outrun actual field conditions. That usually happens when the topic is timely and the crop is entering a sensitive stage. A better approach is to sort fields by crop stage, disease pressure, field history, and remaining yield potential. When those pieces line up, fungicide can still be one of the in-season management tools. When they do not, the recommendation gets harder to defend.

Corn
Corn should still get the first look in many geographies because a lot of acres are entering or approaching the highest-value fungicide window right now. The long-standing emphasis has been that the main leaves worth protecting are the ear leaf and the leaves above it, because those leaves contribute roughly 75 to 90 percent of the carbohydrates needed for grain fill. This is one reason tassel through early silking remains the practical decision window in so many agronomy conversations.
Start scouting immediately prior to tasseling. Check lower leaves up through the ear leaf. If disease is not present below the ear leaf, a fungicide application may not be warranted, and weekly scouting may be a better move than reacting too early. That fits the broader Midwest reality well. Fungicides are not especially forgiving when they are applied too early, and most products are effective for only about 14 to 21 days. Since corn still has a long stretch from silking to maturity, early sprays can lose value before the crop reaches its most important grain fill period.
A few corn checks matter right now
- Confirm actual crop stage by field, not just by windshield appearance.
- Start with corn-on-corn, higher-residue, and more disease-prone hybrid situations first, because those fields carry more foliar disease risk in a typical Midwest system.
- Watch whether lesions are staying well below the ear leaf or beginning to move into the part of the canopy that matters most during grain fill.
- Keep the duration of protection in mind. A spray made too early may not still be carrying enough activity when disease risk matters most.
Be realistic about field potential. Fungicide protects stronger corn better than it rescues stressed corn.
The main point in corn is still discipline. It is easy to talk a field into a fungicide application when disease discussion gets loud. It is more useful to ask whether the field has the disease setup, crop stage, and yield potential that give the pass a reasonable chance to return.
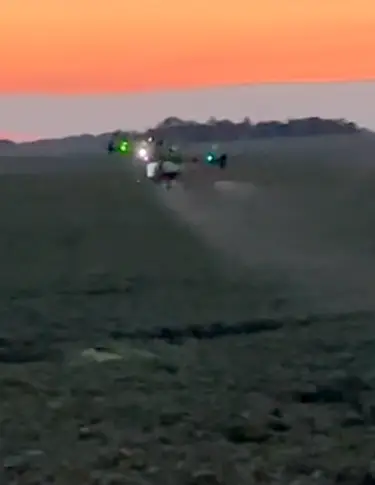
Soybeans
Soybeans deserve the same kind of discipline, even if the conversation usually trails corn. Across much of the region, the key soybean question is whether fields are moving into the R3 window with enough disease risk and enough yield potential left to justify a fungicide trip. That is usually a better question than simply asking whether fungicide is being applied nearby.
That matters in soybeans because fungicide decisions are often influenced by habit. A clean-looking field can still be treated because the operation usually sprays beans at a certain stage. But resistance-management principles argue for a more selective approach. Tank mixes with different modes of action, avoiding reduced rates, and keeping applications tied to real disease pressure are all part of protecting chemistry performance over time.
A few soybean checks matter right now
- Focus first on fields nearing the main reproductive fungicide window and with a history of foliar disease pressure.
- Prioritize fields where canopy density, field history, and longer periods of leaf wetness are more likely to support disease development.
- Keep scouting consistent enough that fungicide decisions are tied to incidence and severity, not just to habit or timing on the calendar.
- Avoid reduced rates and avoid leaning on the same mode of action repeatedly, especially where multiple passes are being discussed.
- Treat fungicide as a crop-protection tool, not an automatic bonus-bushel pass.
Soybean fungicide can still fit very well in the right fields. The better message this week is simply to stay selective. Build the recommendation from disease threat, field history, and crop stage rather than from routine alone.
What likely happens next
For the next seven to ten days, fungicide activity will likely remain in corn and continue to build in soybeans as more acres move into the reproductive window. The strongest near-term fit should remain in corn fields at tassel or early silking where foliar disease is present or likely to move into the upper canopy. Soybean decisions will stay more variable from one field to the next because disease development is often less uniform and stewardship matters more when pressure is not yet obvious.
This is why the most useful agronomy conversations right now are still the simpler ones. Rank fields. Confirm stage. Revisit field history. Decide where disease risk is real. Protect the acres that still have clear yield to defend. Then avoid turning fungicide timing into a routine trip in fields that don’t show enough evidence to support it.
References
- Before applying fungicides to corn: Stop! Look! Consider! — ear leaf protection, scouting before tassel, 14 to 21 day activity, corn-on-corn risk, and economics of fungicide use — Iowa State University Extension — crops.extension.iastate.edu
- Fungicide resistance management in corn, soybean, and wheat in Wisconsin — FRAC groups, resistance risk, scouting-based field history, alternating modes of action, and avoiding curative or reduced-rate use — University of Wisconsin Extension — corn.agronomy.wisc.edu
- Before applying fungicides to corn: Stop! Look! Consider! — hybrid susceptibility, disease position in the canopy, and why timing matters more than simply being early — Iowa State University Extension — crops.extension.iastate.edu
The Earfull July 13, 2026
When Corn and Soybeans Start Making Their Own Weather
In a lot of areas, the air does not just feel hot. It feels heavy. Part of that is the weather pattern itself, but part of it is the crop. As corn and soybean canopies move large amounts of water from the soil, through the plant, and out into the air, they help create the sticky field conditions many scouts are walking into this week.
That matters because a hot, humid stretch is not only a comfort issue for people in the field. It is also a real test of how efficiently plants can keep moving water, keep tissues cool, and hold reproductive timing together as corn reaches tassel and soybeans edge deeper into flowering.
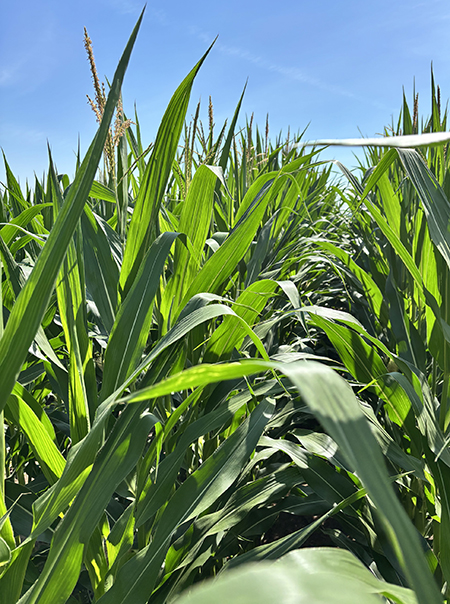
Corn is entering the key window
The main agronomic issue is not simply that highs may reach around 95-100 degrees. The bigger issue is that much of the crop is entering pollination, with some acres just beginning pollen shed and others likely several days into it. The forecast favoring above-normal temperatures across most of the country can be impacted by this growth stage. Here’s why.
Corn has one main way to manage heat: move water. When soil moisture and root function are still adequate, the plant can keep transpiring, which helps cool the canopy and supports continued silk growth and pollen movement. When that water pipeline starts to tighten, the plant shifts quickly from managing heat to conserving moisture, and that is when stress becomes more visible in the field.
This helps explain why two fields with similar calendar dates can respond very differently in the same weather pattern. Deeper soils, stronger rooting, and more even early-season development can give one field enough buffer to move through a hot week with modest impact, while lighter ground or compacted areas may begin to roll early, shorten silk growth, and raise concern about kernel set.
Humidity is an important part of this story. High humidity can reduce atmospheric demand compared with a hot, very dry wind event, but it also reflects how much water the crop is already pushing into the air. In other words, the same humidity that makes the day feel oppressive can also be a sign that the crop is working hard to cool itself.
The practical question is whether fields can keep that cooling system running through pollen shed. If plants still have access to moisture, the crop can often ride through several warm days. If moisture supply slips, especially on lighter soils or in uneven parts of fields, stress can show up first in delayed silk emergence, extended leaf rolling, and greater variability from one ear to the next.
What to watch during pollen shed
This is a good week to shift scouting from general appearance to reproductive function. A field can still look decent from the road and be less synchronized than expected once you move beyond the ends and start checking tassels, silks, and plant response through the middle of the day.
A few checks matter right now:
- Confirm actual pollen shed timing by field instead of relying on tassel visibility alone. A field that has tasseled is not necessarily shedding uniformly yet.
- Watch how early leaf rolling begins and how long it lasts. Brief afternoon rolling is different from leaves tightening by late morning and holding most of the day.
- Check silk emergence across multiple management zones, especially lighter soils, compacted areas, and places that ponded earlier in the season.
- Pay attention to warm nights. Limited nighttime recovery can leave plants starting the next day with less margin than they had before.
A useful way to describe this week’s risk is this: heat by itself is not automatically a yield loss story, but heat during pollen shed can become one quickly if it overlaps with uneven moisture supply or weak silk progression. That is why this stage deserves more than a windshield check.
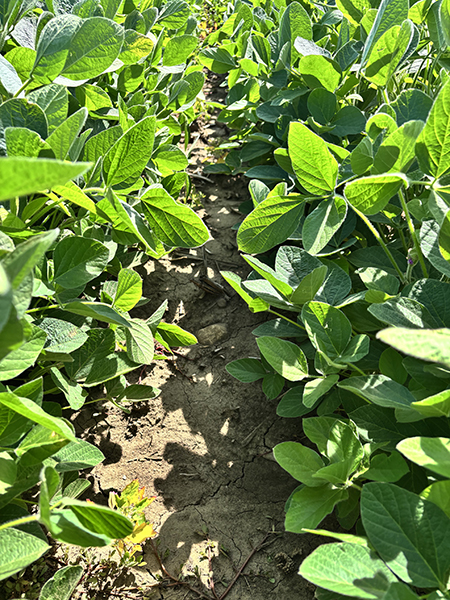
Soybeans are helping create the humidity, too
Soybeans are not at the same make-or-break stage as pollinating corn, but they are still part of the heat story. Many bean fields are building canopy, moving into flowering, and transpiring heavily, which contributes to the damp, heavy air many people are noticing around productive fields.
This does not mean soybeans are carefree under these conditions. If moisture remains available, beans can usually handle short stretches of heat better than corn and still retain strong yield potential. But warm nights, dense canopies, and prolonged humidity can raise respiration costs and increase the chance that disease risk starts to build in fields with a history of foliar pressure.
Soybeans also remind us why broad crop ratings only tell part of the story. A statewide number can look stable while individual fields differ sharply based on planting date, canopy closure, weed competition, compaction, and rainfall luck over the last few weeks.
Field reality over headline reality
Markets have been reacting to weather concerns, and forecasts continue to keep traders focused on the pollination window. That attention makes sense, but the best agronomic read this week still comes from separating field classes by actual stress response instead of by headline intensity.
References
- Purdue University Extension. (2022). Heat Stress and Drought Considerations for Corn.
https://extension.entm.purdue.edu/newsletters/pestandcrop/article/heat-stress-and-drought-considerations-for-corn/ - Iowa State University Extension and Outreach. (2025). Corn pollination: effect of high temperature and stress.
https://crops.extension.iastate.edu/encyclopedia/corn-pollination-effect-high-temperature-and-stress - Michigan State University Extension. (2020). Moisture stress and high temperature effects on soybean yields.
https://www.canr.msu.edu/news/moisture_stress_and_high_temperature_effects_on_soybean_yields
The Earfull July 6, 2026
As We Head into the First Full Week of July
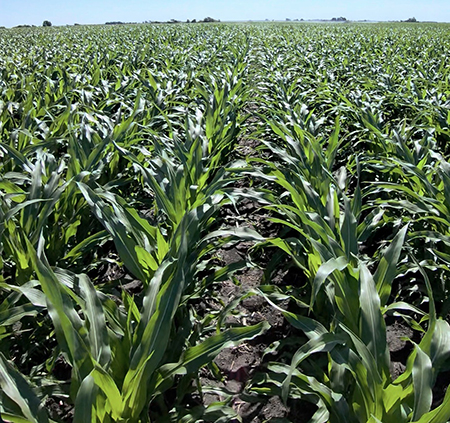
This week’s EARFULL takes a step back from the noise and looks at what early July heat and humidity mean for pollination, how to think about good-to-excellent crop ratings, and what is worth scouting in your own fields over the next 10 to 14 days.
Early July heat
Forecasts point to a hot, humid start to July across much of the central and eastern United States. Not to overstate it, but heat index values frequently topping 100 degrees and warm nights offering limited recovery. That lines up with what many growers are seeing in the field as corn begins to show stress faster on lighter soils and more exposed ground.
From an agronomy standpoint, the key questions are timing and duration. Corn is most vulnerable when high heat overlaps the pollination window, especially when nights stay warm and soil moisture is already drying out. A brief burst of heat with decent subsoil moisture is usually a stress test. A longer stretch of heat, wind, and limited rainfall is when real concern starts building around kernel set.
A few field checks matter this week:
- Flag fields that are within 10 days of tassel and already showing stress on lighter soils.
- Monitor overnight lows alongside daytime highs, as warm nights reduce crop recovery.
- Note when leaf rolling begins. Corn that rolls by mid-morning and stays there all day is signaling that the moisture profile is getting short.
The goal is not to overreact to a single hot forecast, but to identify which fields could become vulnerable if the pattern holds.
Crop condition
USDA reporting showed U.S. corn with 67 percent rated good to excellent and soybeans at 65 percent good to excellent as of late June. This reflects generally favorable conditions across much of the Midwest, helping explain why market commentary can sound calm even while individual farms are dealing with drowned-out spots, uneven stands, or short-term moisture stress.
Both views can be true at the same time. Broad ratings capture the region, but they do not highlight field-to-field variability. University and federal climate resources for Midwest agriculture also point to greater weather variability and uneven rainfall patterns as ongoing management challenges for corn and soybean systems.
That makes local field evaluation more valuable than ever. Scouting tips at this critical stage:
- Walk beyond the end rows before judging stand and vigor.
- Rate fields as solid, borderline, or concerning based on stand, color, root development, and soil moisture.
- Pay close attention to areas that either ponded in June or consistently missed rainfall, because those zones may react very differently under this early July heat.
By early July, field reality usually tells more than a statewide average.
Soybeans still have runway
Soybeans have generally progressed well so far this season, and early condition ratings have stayed favorable in many key states. This has encouraged some early-season optimism, but soybeans still have a long way to go before final yield is set.
Beans can compensate better than corn if they catch moisture during flowering and pod set, but they remain sensitive to stress during reproductive development. Iowa State’s late-June regional crop update noted that soybeans were generally in the V3 to V5 range while much of the corn crop was in the V5 to V7 window, reinforcing that both crops were still moving through important vegetative stages heading into July.
A practical soybean checklist for the next two weeks includes:
- Check growth stages in the fields carefully so you know which acres are moving into flowering under stress.
- Prioritize weed escapes, especially where late competition can rob moisture and sunlight.
- Watch denser canopies, where continued humidity could raise disease risk.
Strong-looking beans in late June are encouraging, but they are not a finished crop.
As the calendar turns into July, the conversation should stay centered on timing. Heat alone does not necessarily mean yield loss, and strong early ratings do not guarantee the rest of the season. Pollination, flowering, soil moisture, and field variability are the real story right now.
The best move this week is simple: scout the fields closest to tassel and first bloom, sort them by risk, and keep separating general talk from field-specific reality. This approach usually leads to better agronomy decisions than reacting to the loudest headline.
References
- Farms.com. (2026, June 28). July heat wave puts Midwest corn and soybeans under pressure.
https://www.farms.com/ag-industry-news/july-heat-wave-puts-midwest-corn-and-soybeans-under-pressure-822.aspx - USDA Climate Hubs. (n.d.). Agriculture in the Midwest. https://www.climatehubs.usda.gov/hubs/midwest/topic/agriculture-midwest
- Iowa State University Extension and Outreach. (2026, June 28). Regional crop update: June 15 – June 23, 2026. Integrated Crop Management. https://crops.extension.iastate.edu/post/regional-crop-update-june-15-june-23-2026
The Earfull June 22, 2026
What Needs Attention Right Now
By this point in June, the crop has usually settled enough that the overall story starts to look fairly positive from the road. A lot of corn has good color. A lot of soybeans are moving along. Most fields are far enough along that the season feels established rather than uncertain. This is the good news.
The other side of the story is that it’s also the time when averages become less useful. As a whole, the field can still look decent and yet have enough stress pockets, stand variation, root issues, or weed escapes to quietly trim yield potential before anyone fully realizes it. This is why the better agronomy conversations right now are shifting away from broad planting progress and toward a much more practical question: where is the crop beginning to separate inside the field?
Nationally, the crop remains in a generally workable position. USDA condition ratings suggest both corn and soybeans are still holding together reasonably well as we move deeper into June. That is encouraging. But those ratings do not tell the full local story, especially in areas where compaction, variable rainfall, sidewall effects, crusting, uneven emergence, or herbicide timing are now becoming more apparent.
Corn
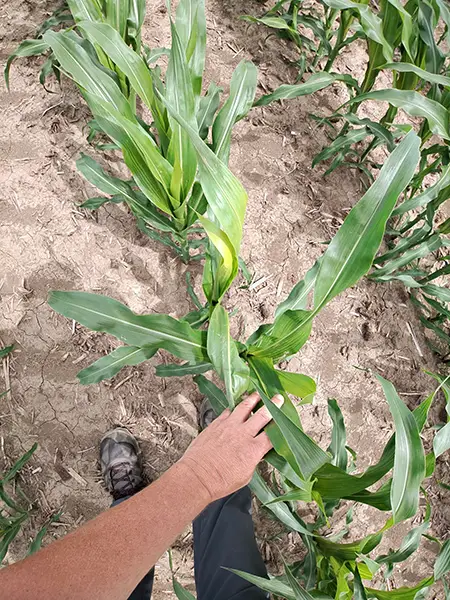
Corn is moving fast enough now that some early-season issues can get masked for a while. A field may have a strong green color from the road and still contain areas where root development is weaker than expected, growth is uneven, or nutrient uptake has been limited by early conditions. In many cases, these are the same places that tend to show up every year: sidehills, worked ends, low spots, compacted zones, or fields where planting conditions were just a little less forgiving than the grower thought at the time.
This is a good week to look beyond color alone. Pale or uneven corn does not always mean the same thing. Sometimes, it is a temporary response to cooler soils or saturated conditions that the crop will largely outgrow. Other times, it is a sign that the root system never fully established itself as it needed to. Or, it could be that nitrogen and sulfur uptake are lagging because the plant has not had ideal conditions to keep pace with rapid vegetative growth.
The main point is to identify whether the pattern is random or repeatable. If the issue lines up with wheel tracks, drainage patterns, soil changes, or known parts of the field, there is usually something useful to learn from it. Those are the fields worth digging. Pull some plants. Check root development. Look for sidewall restriction, shallow roots, crown health, and whether nodal roots are doing what they should at this stage.
Soybeans
Soybeans deserve the same kind of attention right now, even though they can be easier to overlook. A soybean field often has a way of appearing acceptable until you walk farther into it. Once you walk into it, things may begin to stand out more than they did from the road: thinner areas, uneven growth, crusted pockets, ponded spots, or delayed sections.
This is especially true in fields that were planted in less-than-ideal conditions or in those that had an uneven start. In June, soybeans can still compensate for a lot. They compensate best when the stand is more uniform than it first appears and when stress remains relatively limited from this point forward. Where populations have thinned or roots are restricted, the field may still be fine overall, but it deserves a closer look before writing it off as “good enough.”
This is also the point where weed pressure starts becoming more visible. Residual programs that looked solid earlier can begin to lose their edge, and escapes start showing up in the fields that were a little delayed, a little uneven, or simply stretched on timing. That does not mean every field has a major weed problem. It does mean this is the week to identify the acres where weeds are starting to win small battles before they become larger ones.
The Next 7 to 10 Days
For the next week or so, the best use of scouting time is probably not in the cleanest or most even fields. It is in places that feel just a little off. That could be corn that is not quite as uniform as the neighboring field. It could be soybeans that seem a little thinner than expected. It could be fields where the first pass looked good, but you are starting to wonder if weeds are slipping through.
In corn, keep the focus on stand consistency, root strength, and whether stress follows a clear pattern. In soybeans, count viable plants in weaker spots, look at root development, and ensure emerging weed escapes are identified while practical options are still available. This is also a good time to make notes that will matter later. Many of the best decisions in July and August come from observations made now.
There is still a lot of yield potential ahead for this crop. Most acres do not need a dramatic reaction. They need a careful eye, timely walking, and a willingness to investigate the areas that are easy to dismiss when the rest of the field looks fine. This is usually where the most useful answers are found at this time of year.
References
- USDA NASS Crop Progress and Condition https://www.nass.usda.gov/Charts_and_Maps/Crop_Progress_&_Condition/index.php
- USDA Crop Progress reports archive https://esmis.nal.usda.gov/publication/crop-progress
- Ohio State Agronomic Crops Network – C.O.R.N. Newsletter https://agcrops.osu.edu/newsletter/corn-newsletter/2026-16/full
No post found

No post found
No post found
No post found
No post found
No post found
No post found
No post found
No post found